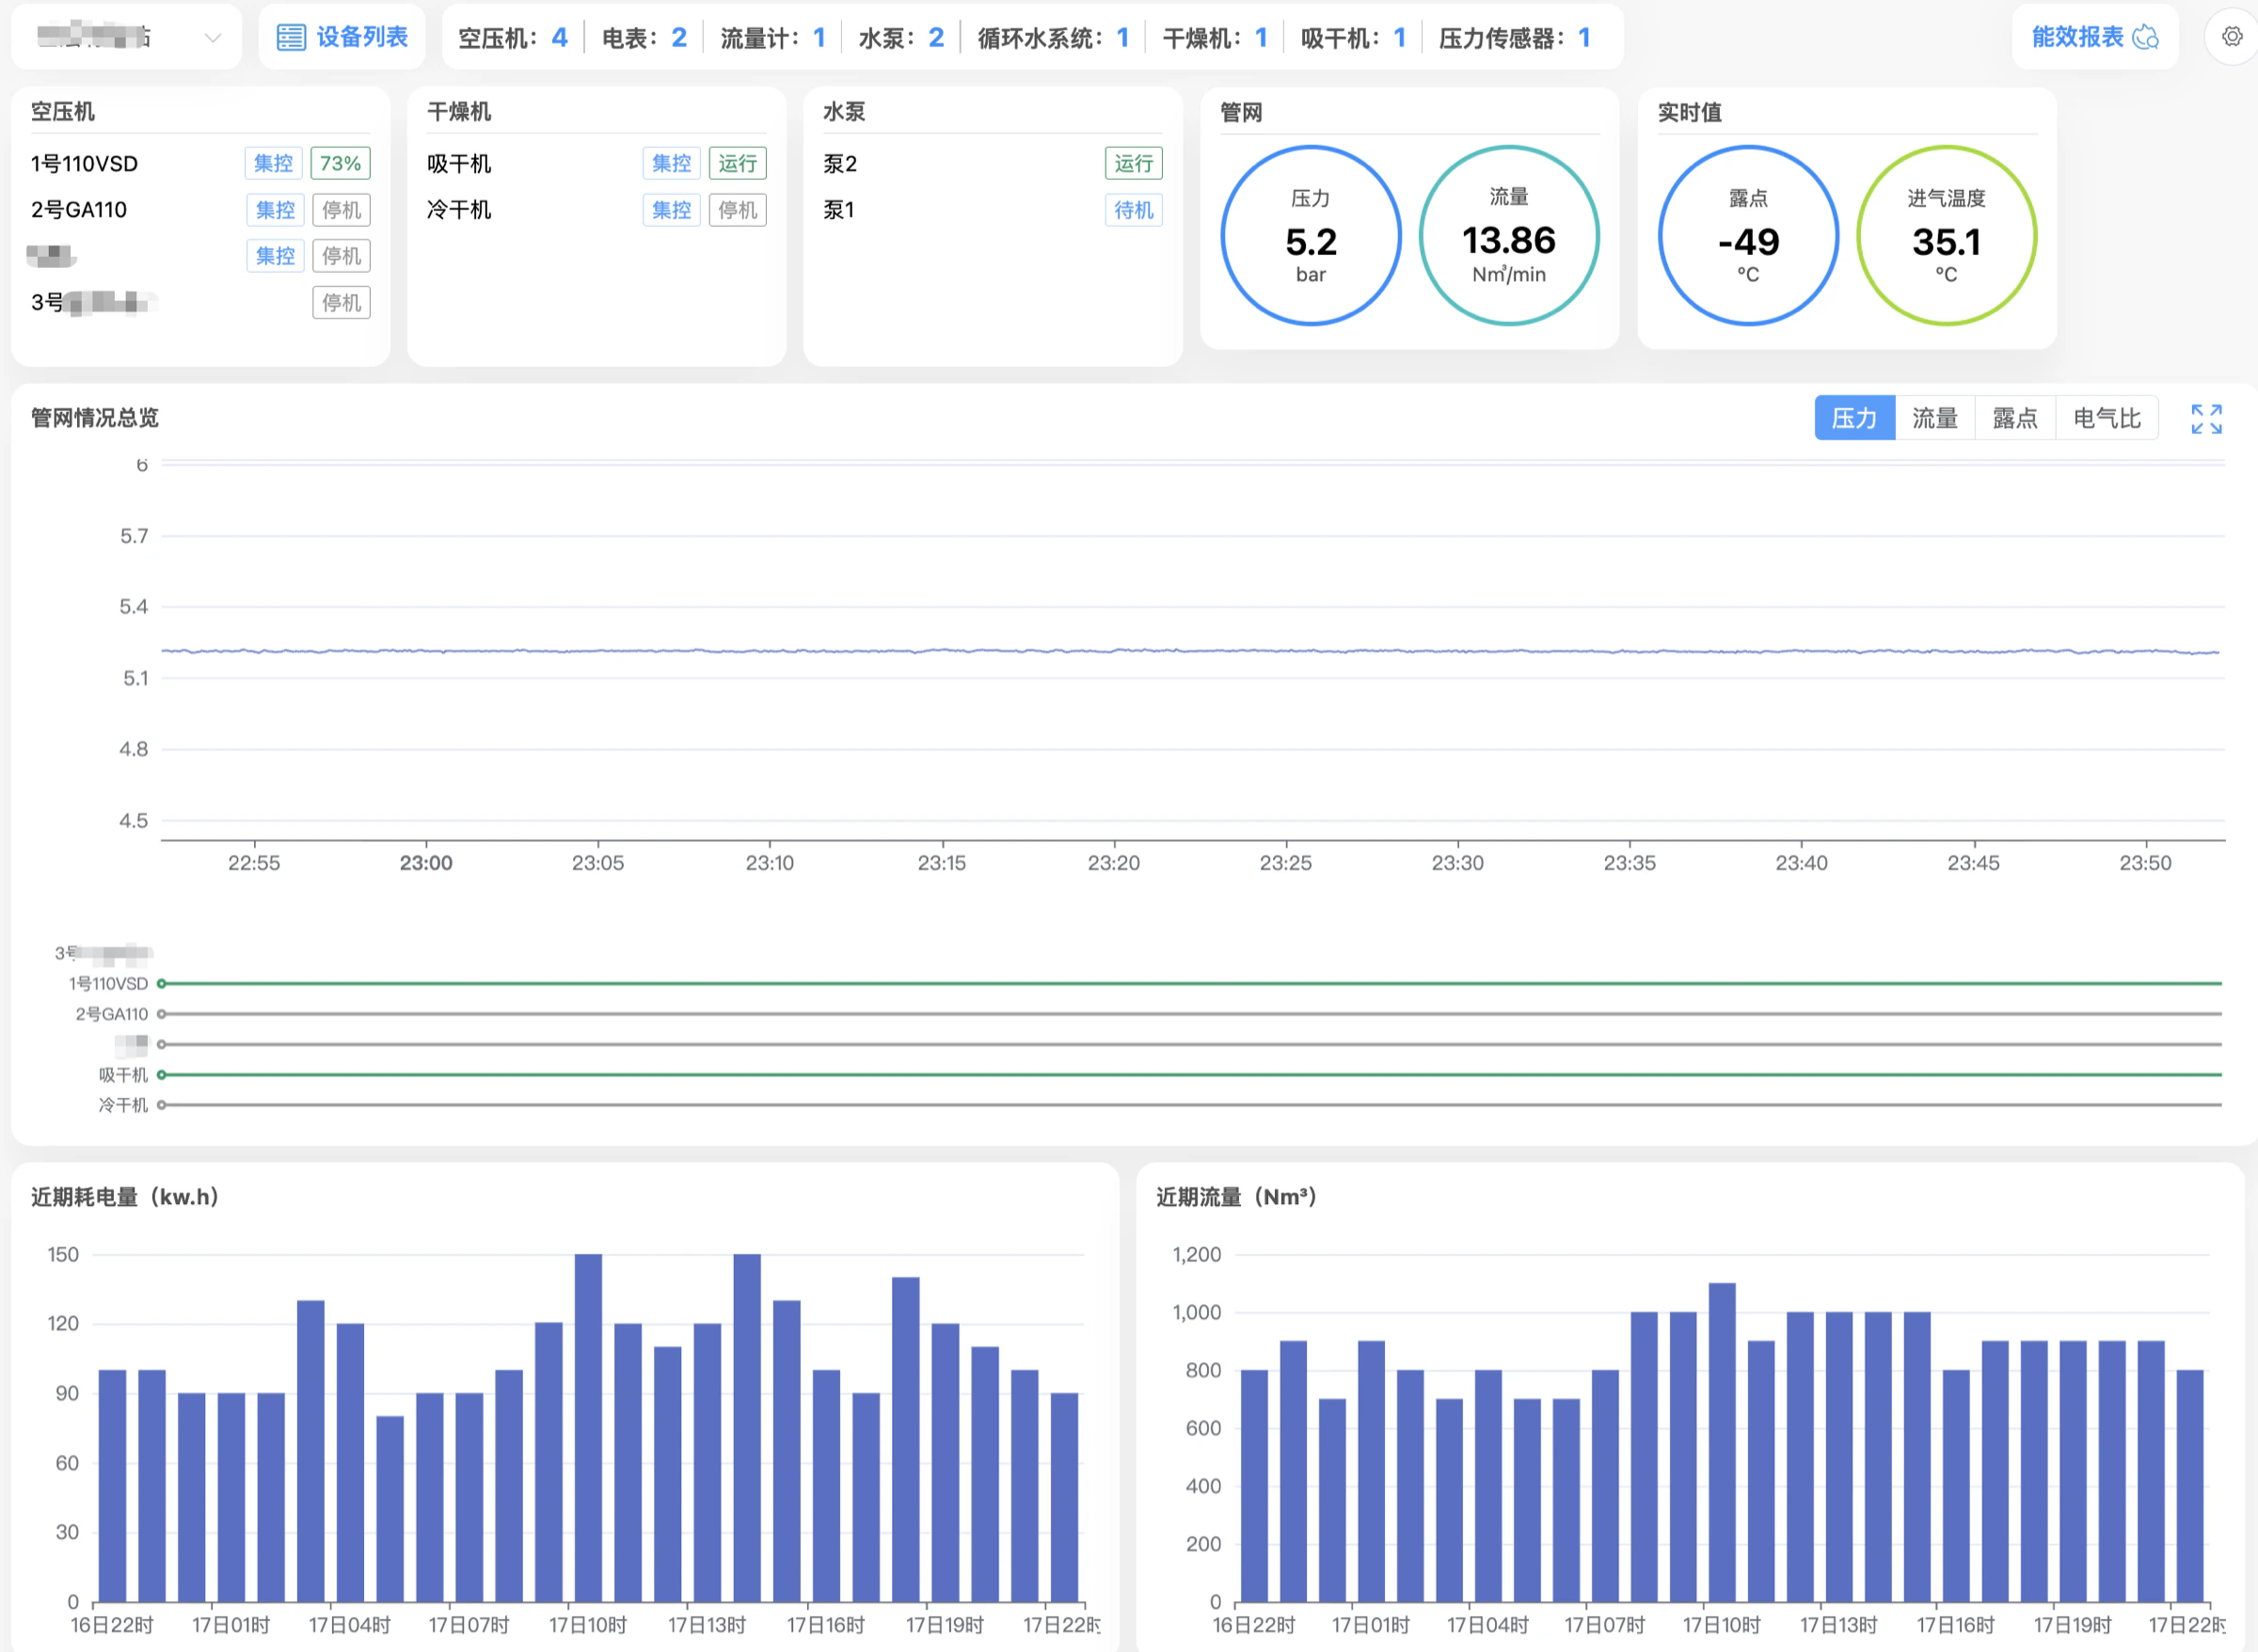
Equipment list · Live data
One unified list of all station equipment; drill down to live parameters and history trends per unit.
 Contact Us
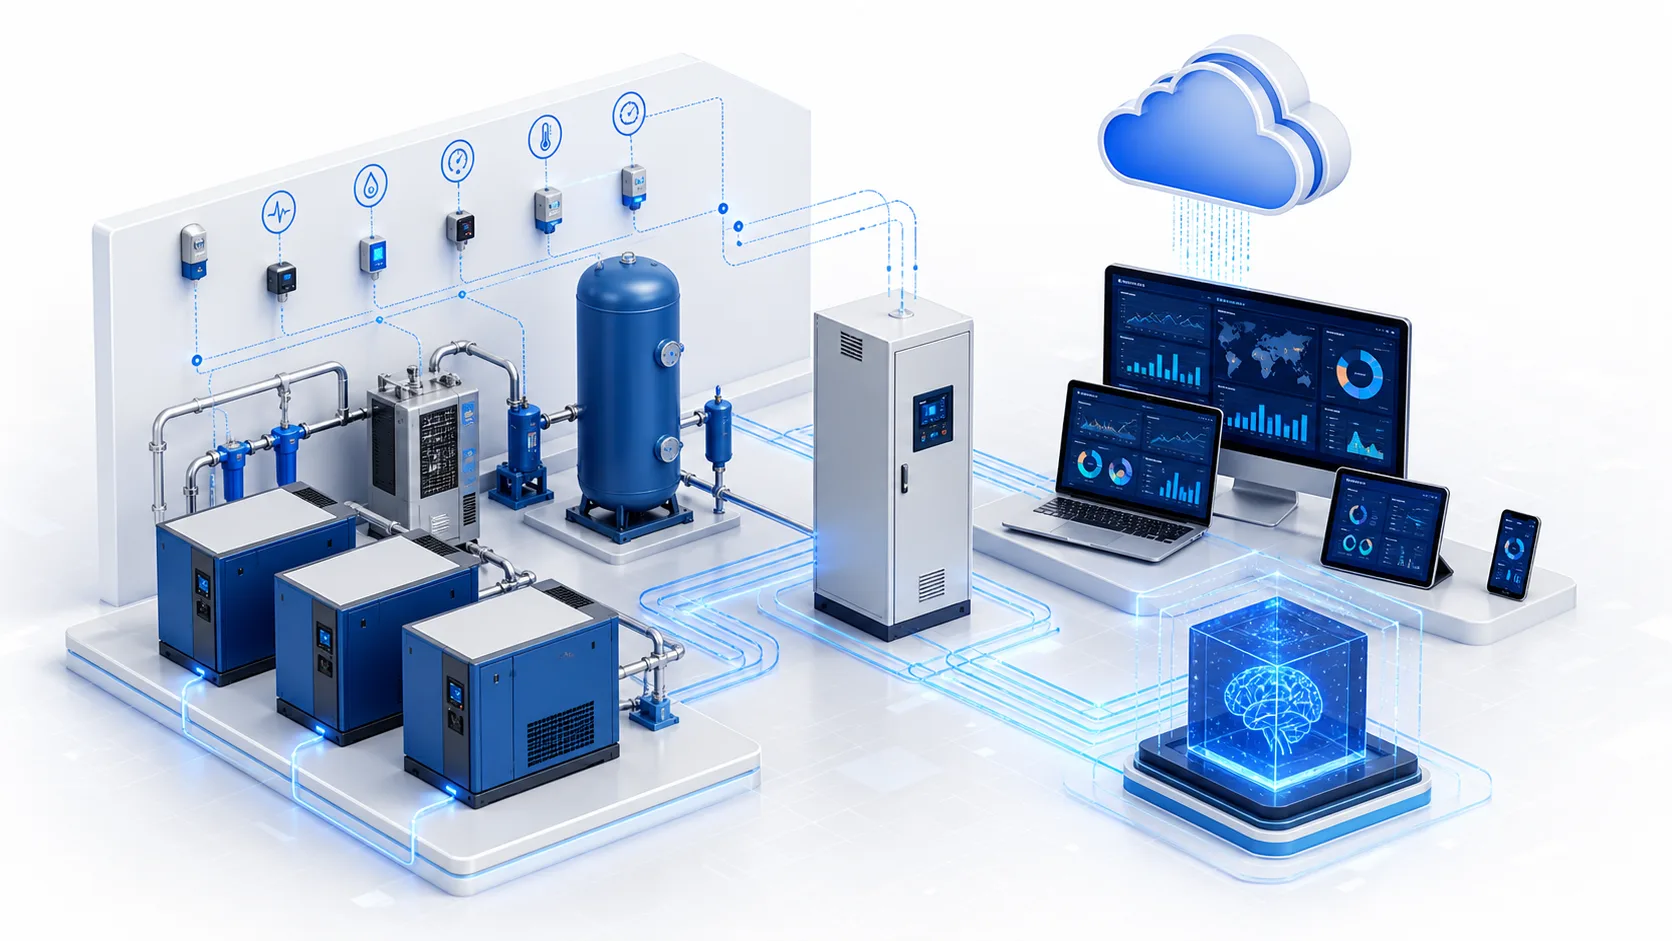
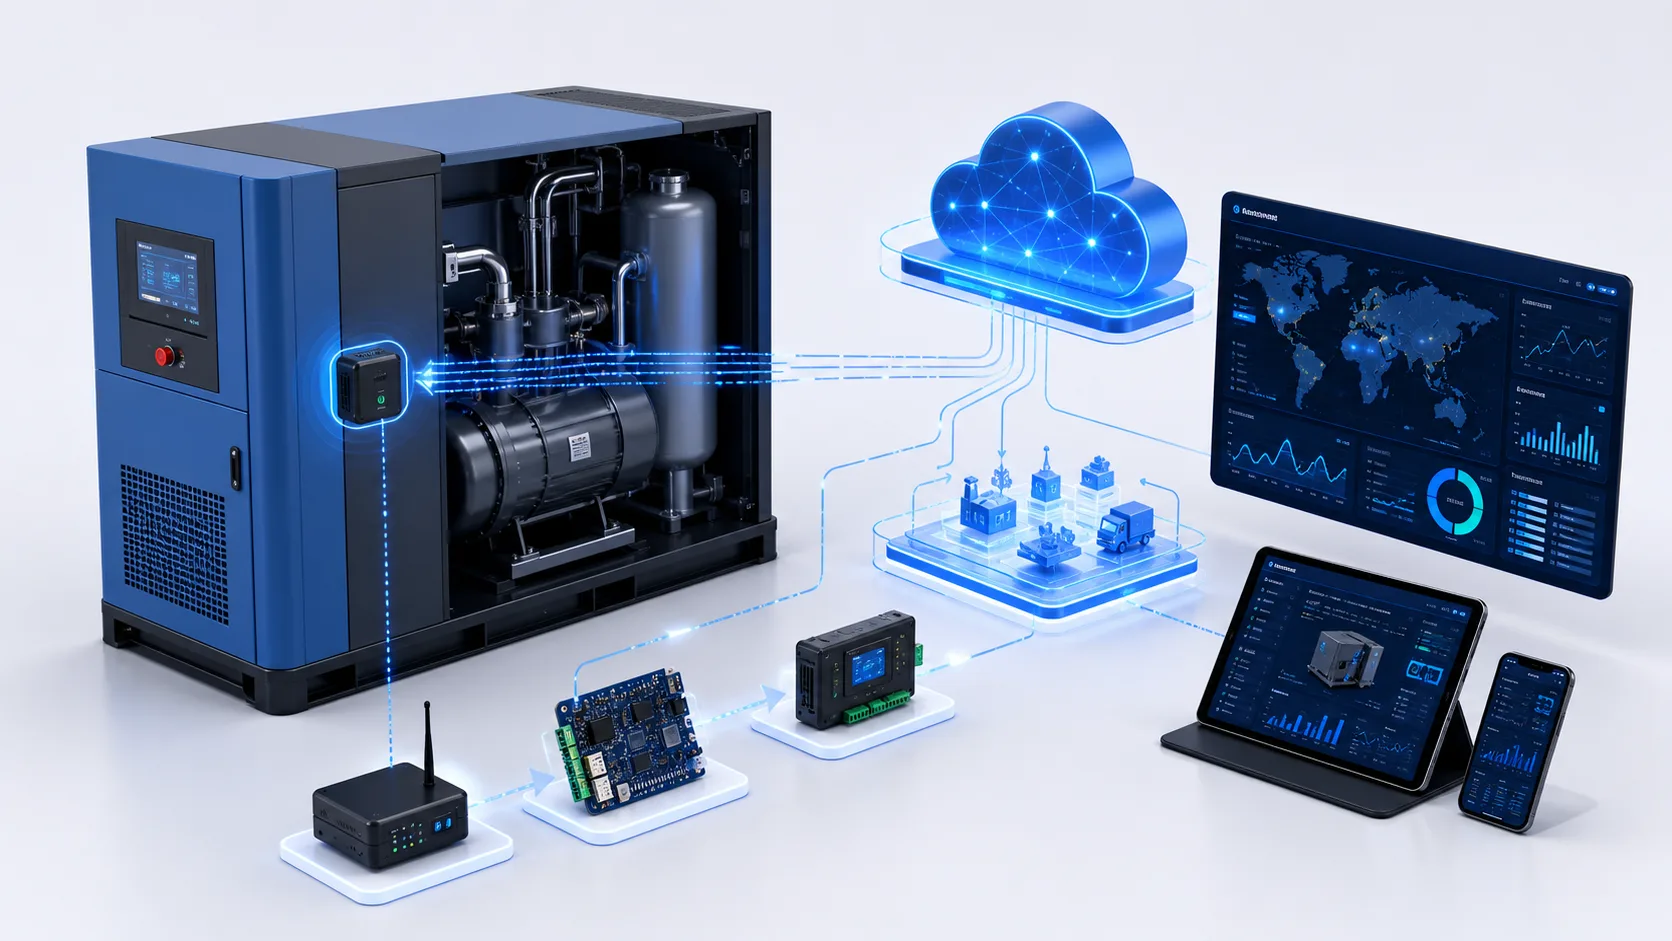
The CompView equipment and energy management platform takes in field data from MS, MGate and Mbox, delivering station overviews, historical trends, energy reports and alarm records. Browser/server (B/S) architecture — ready to use in a browser or WeChat mini program, nothing to install.
IoT plus power meters / flow meters / dew point sensors, sampled in real time into the database
Continuous trend records for every measuring point, ready for traceback and comparison
Multi-dimensional statistics to pin down unit energy consumption and locate energy hogs
Baseline-based early warning that flags anomalies before they become downtime
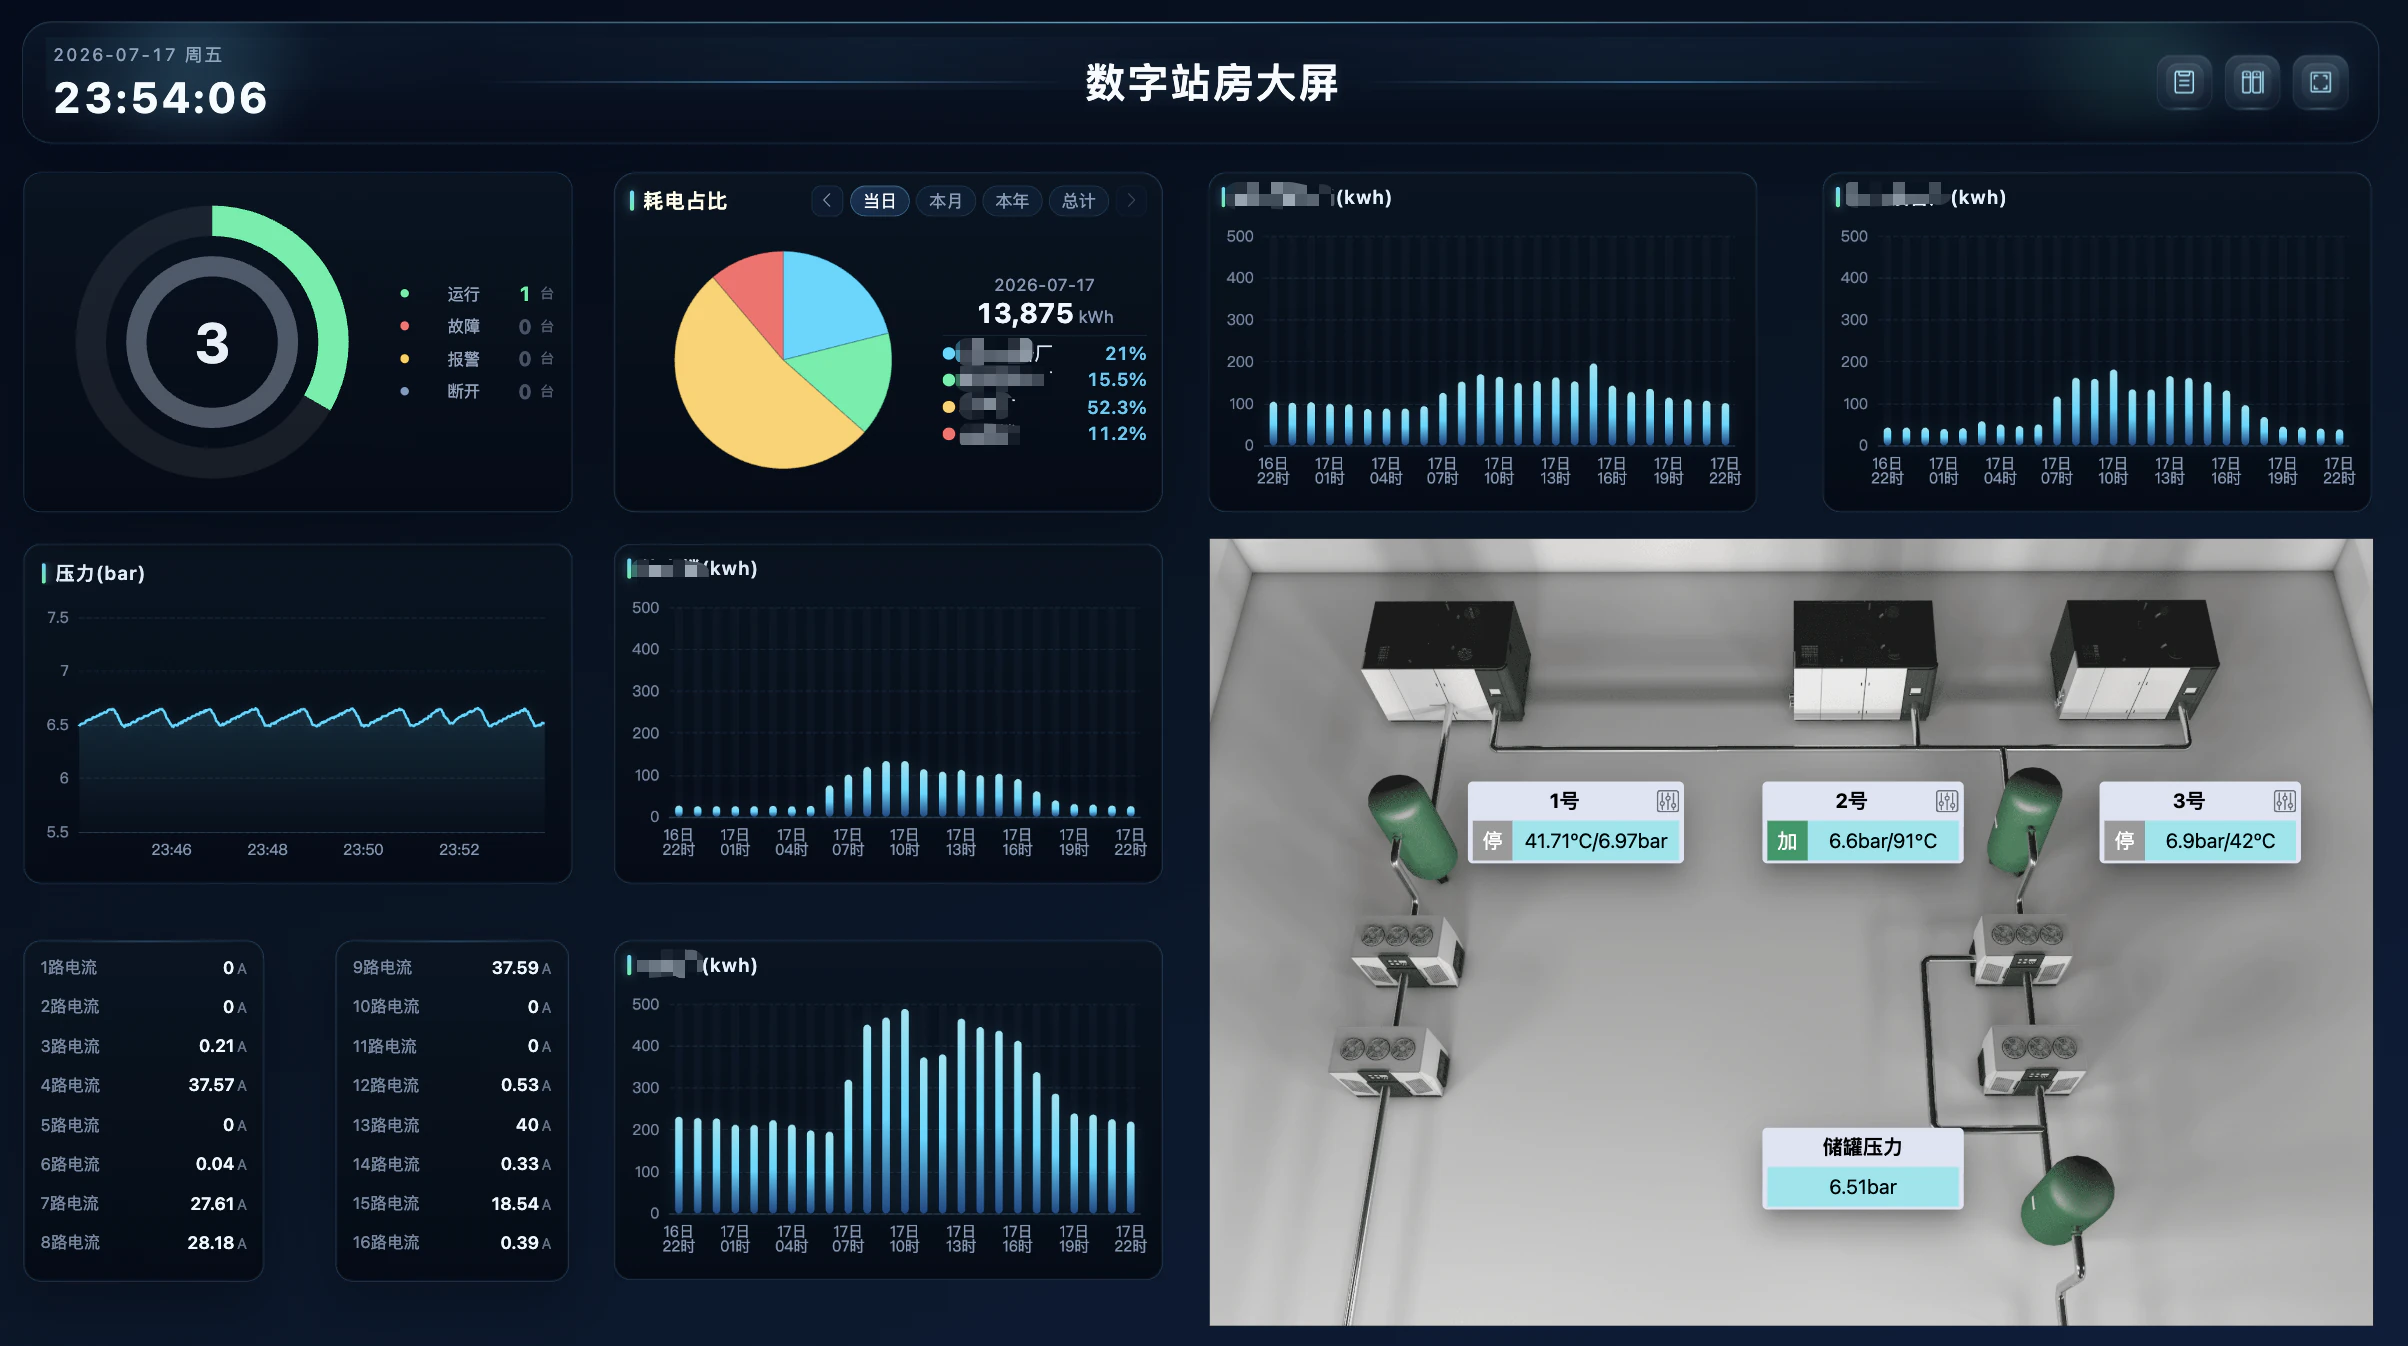
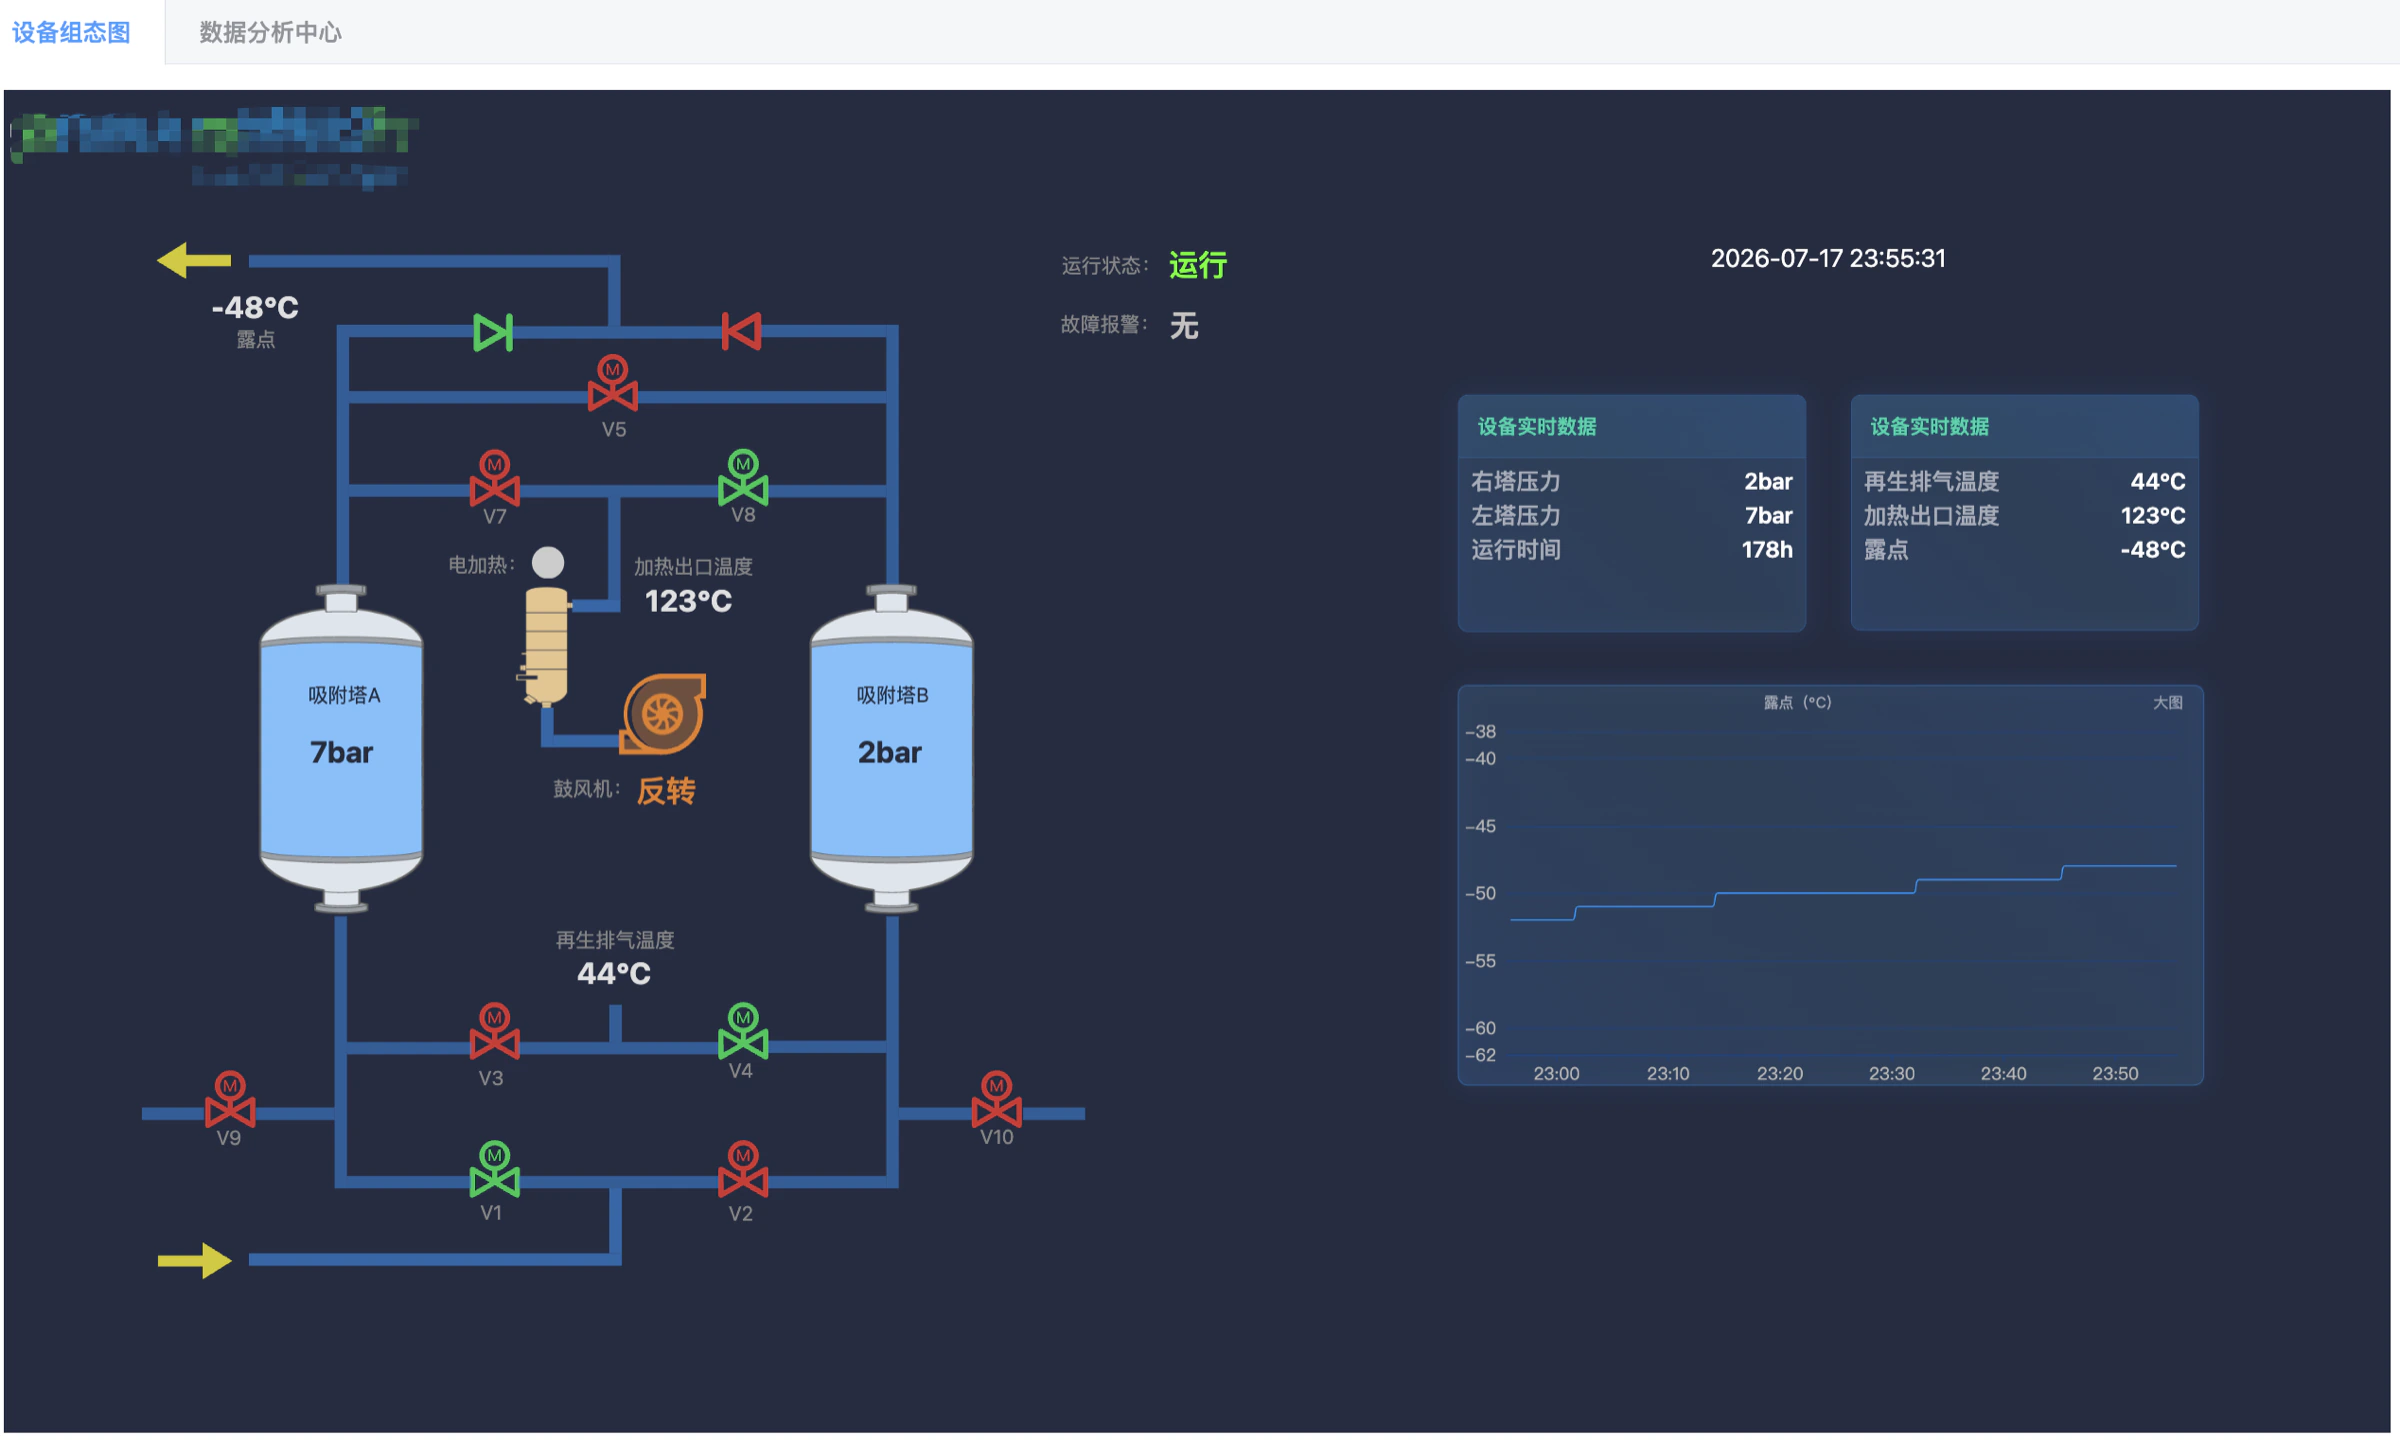
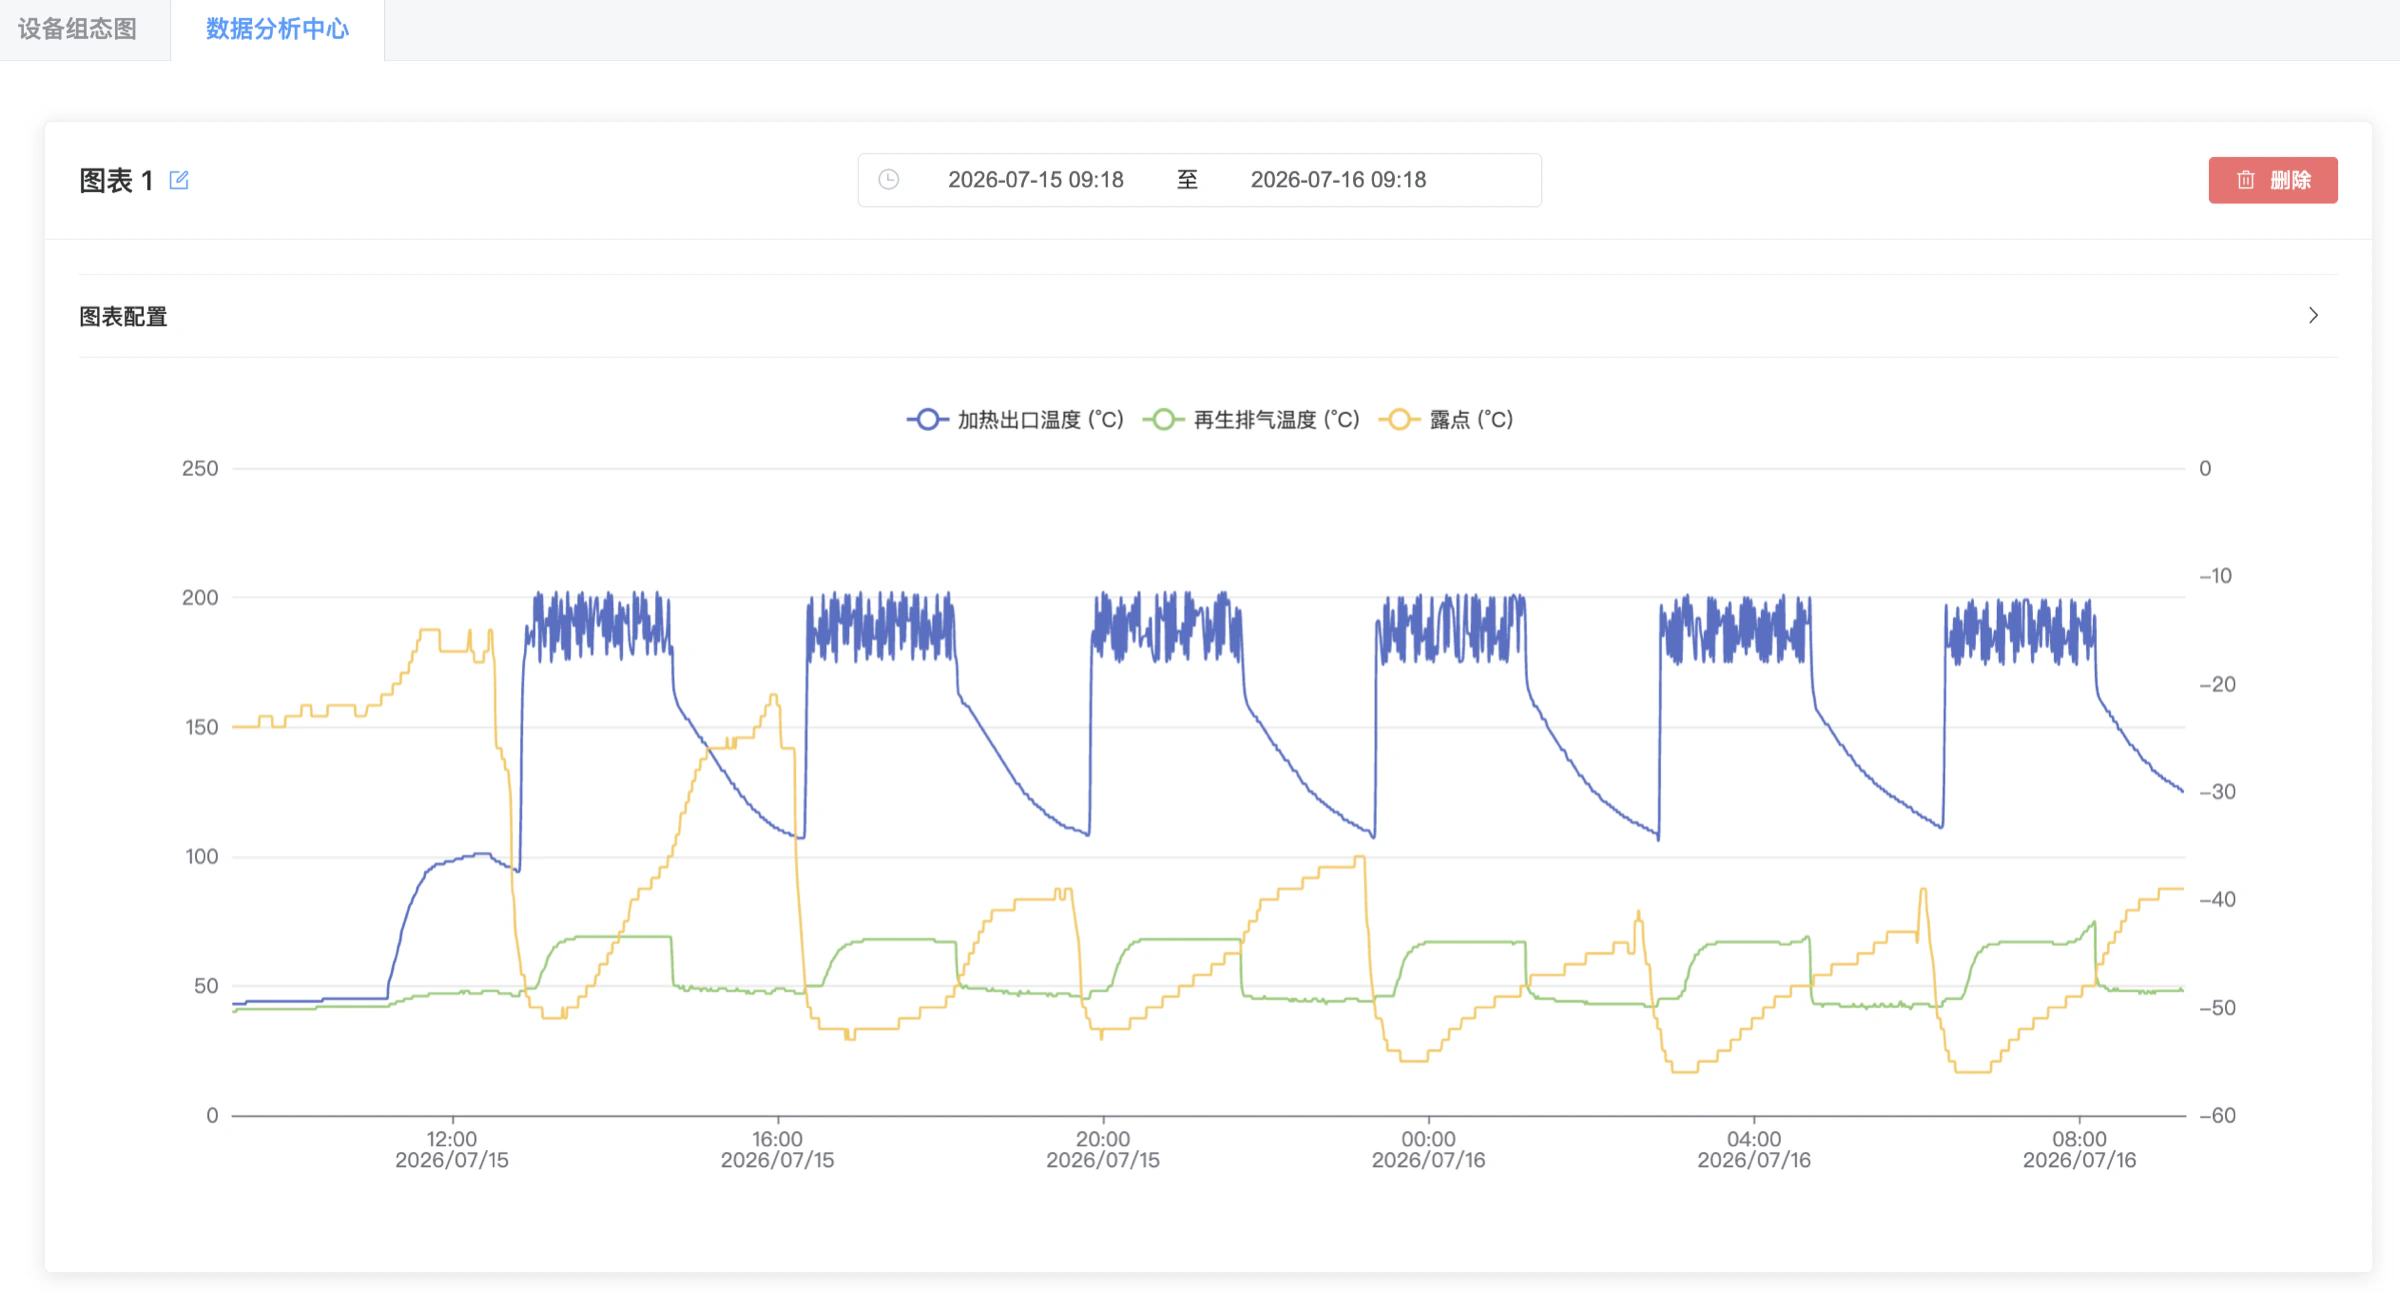
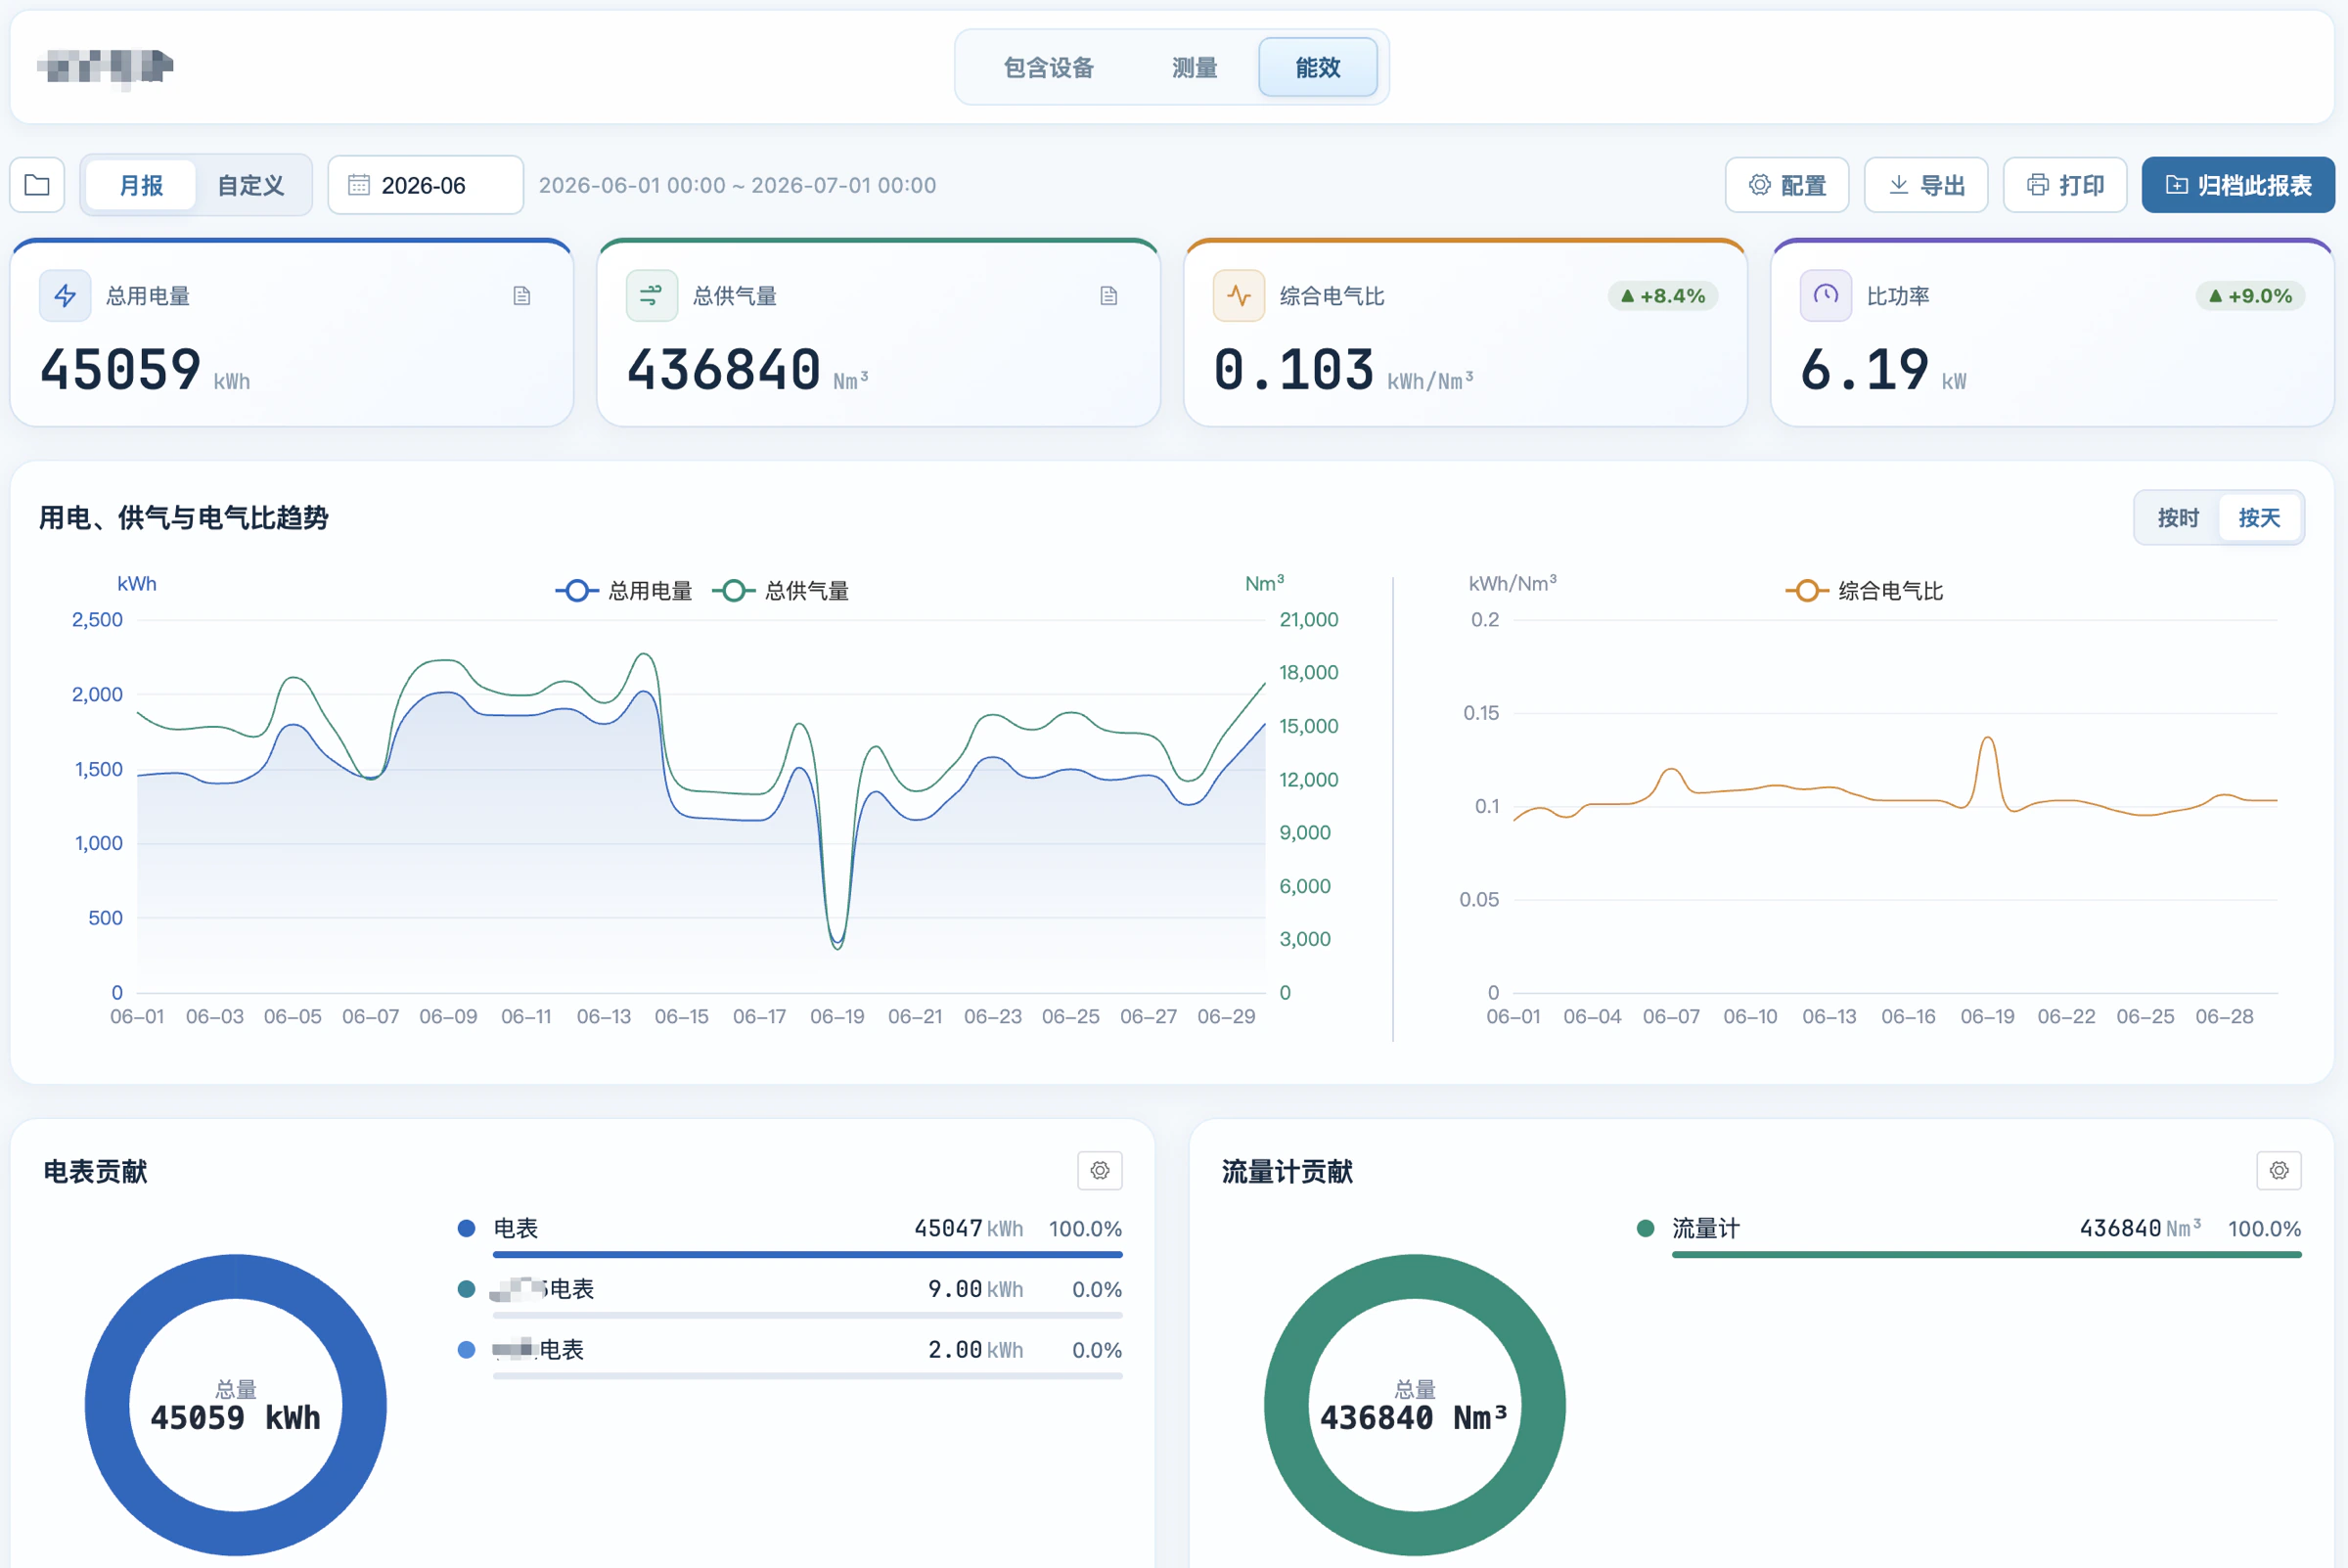
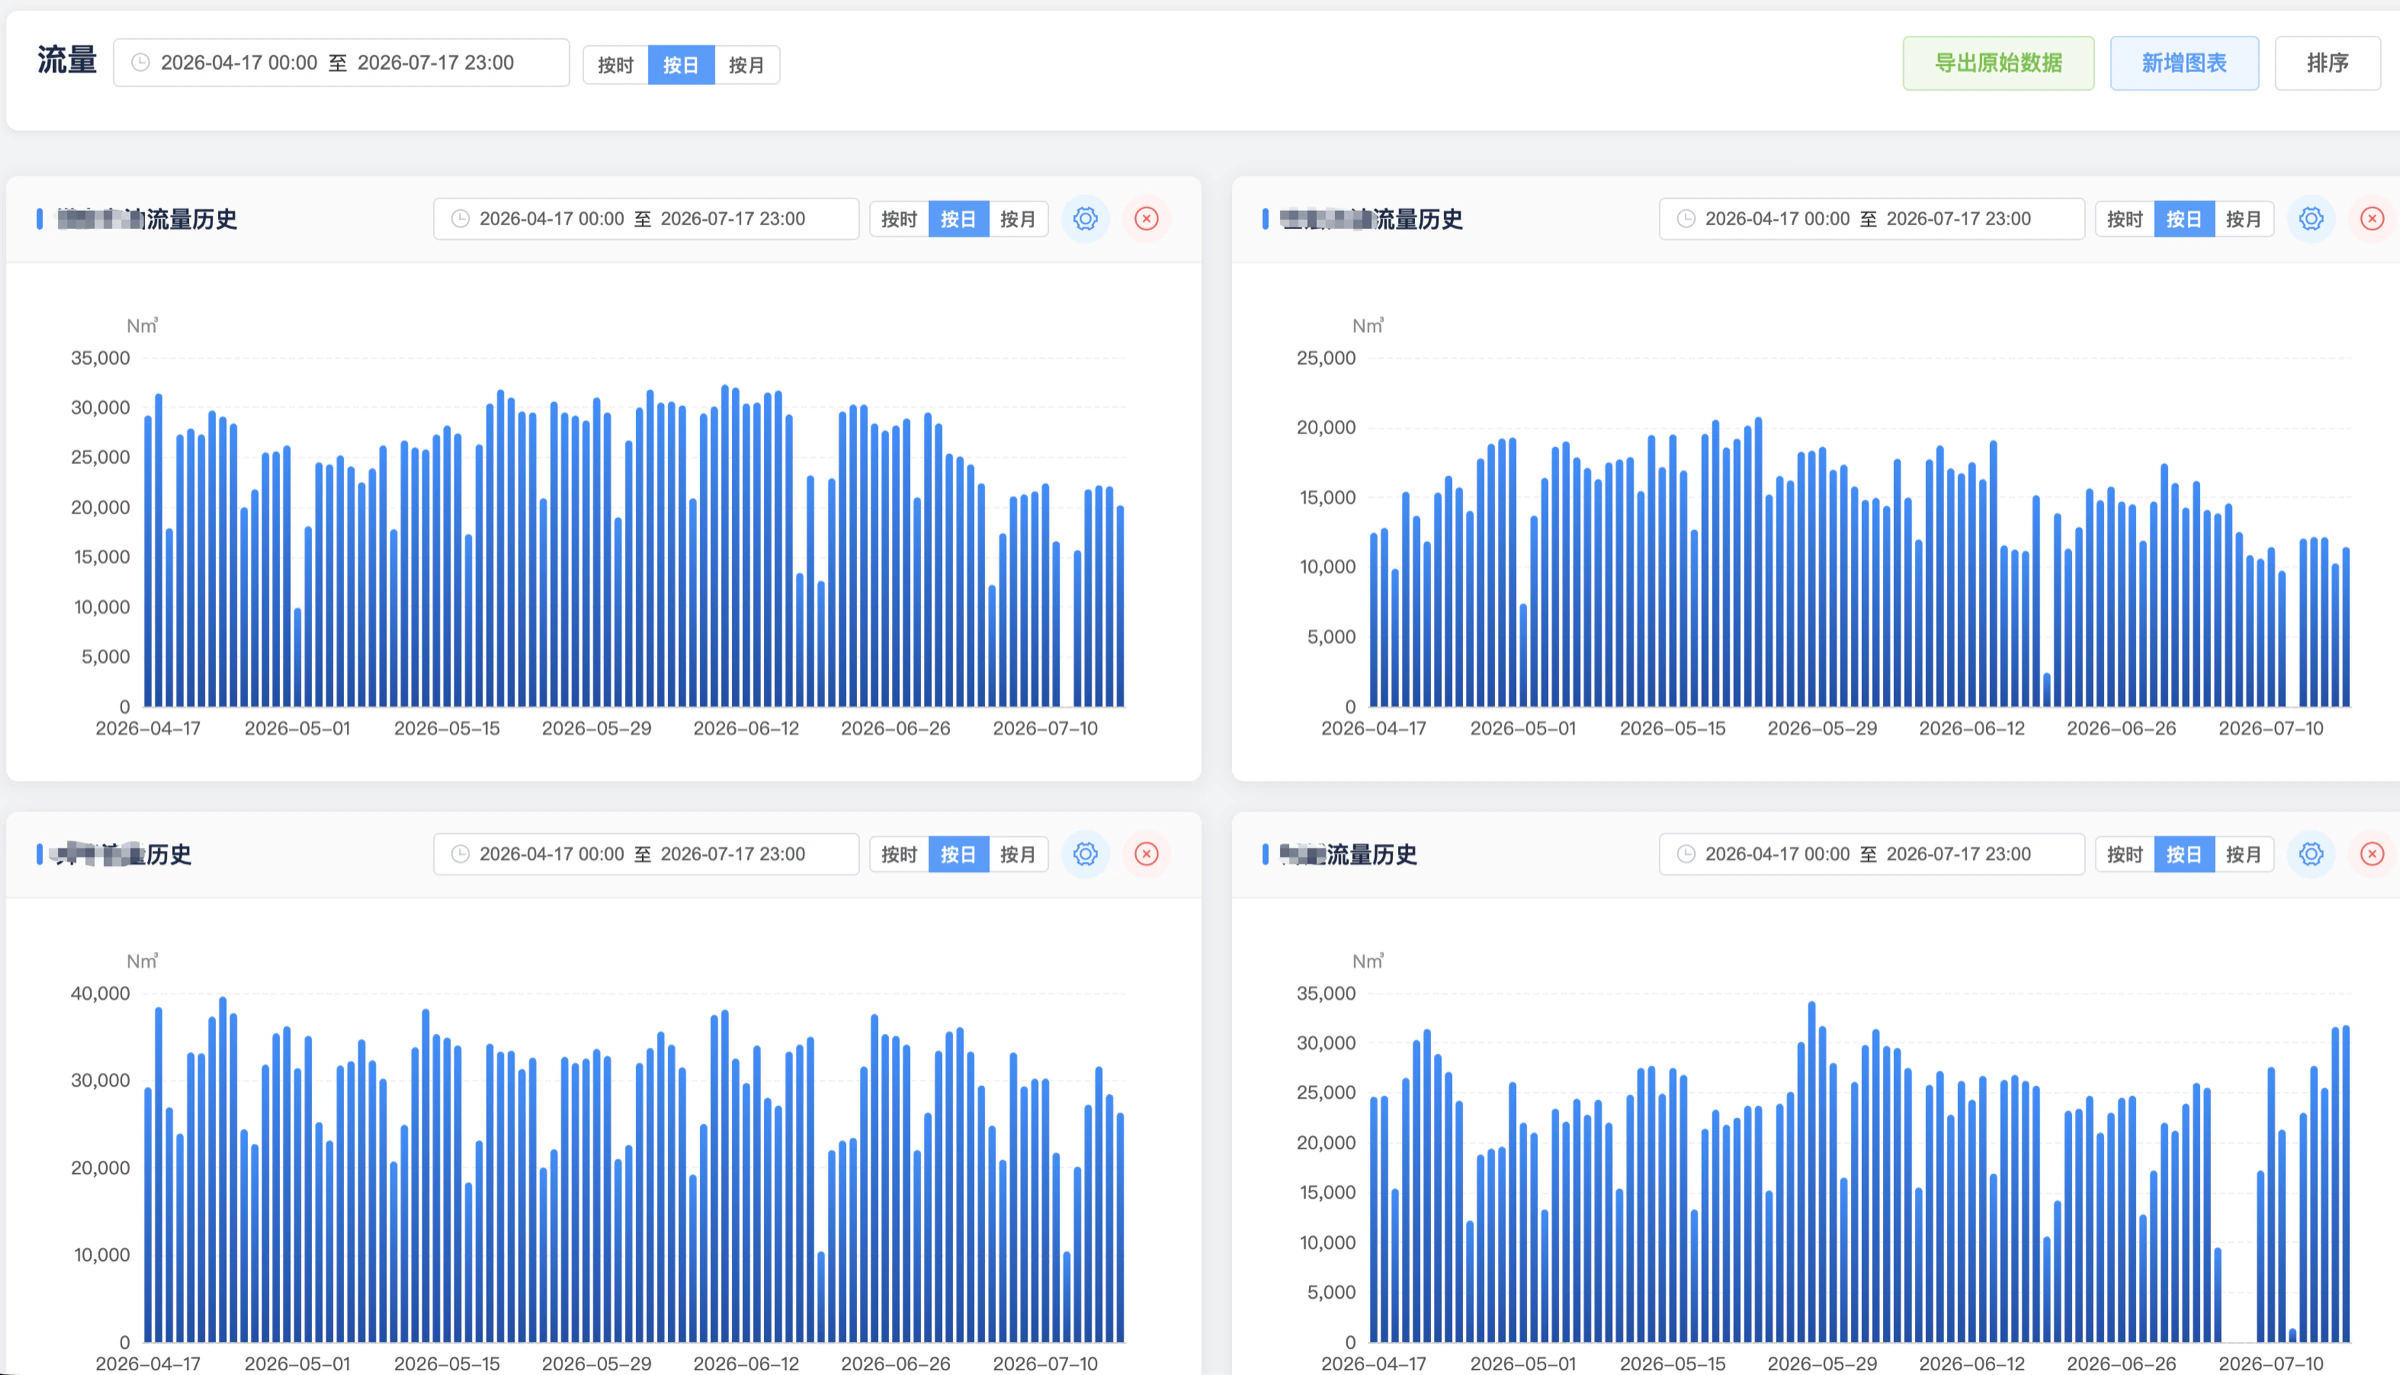
One unified list of all station equipment; drill down to live parameters and history trends per unit.
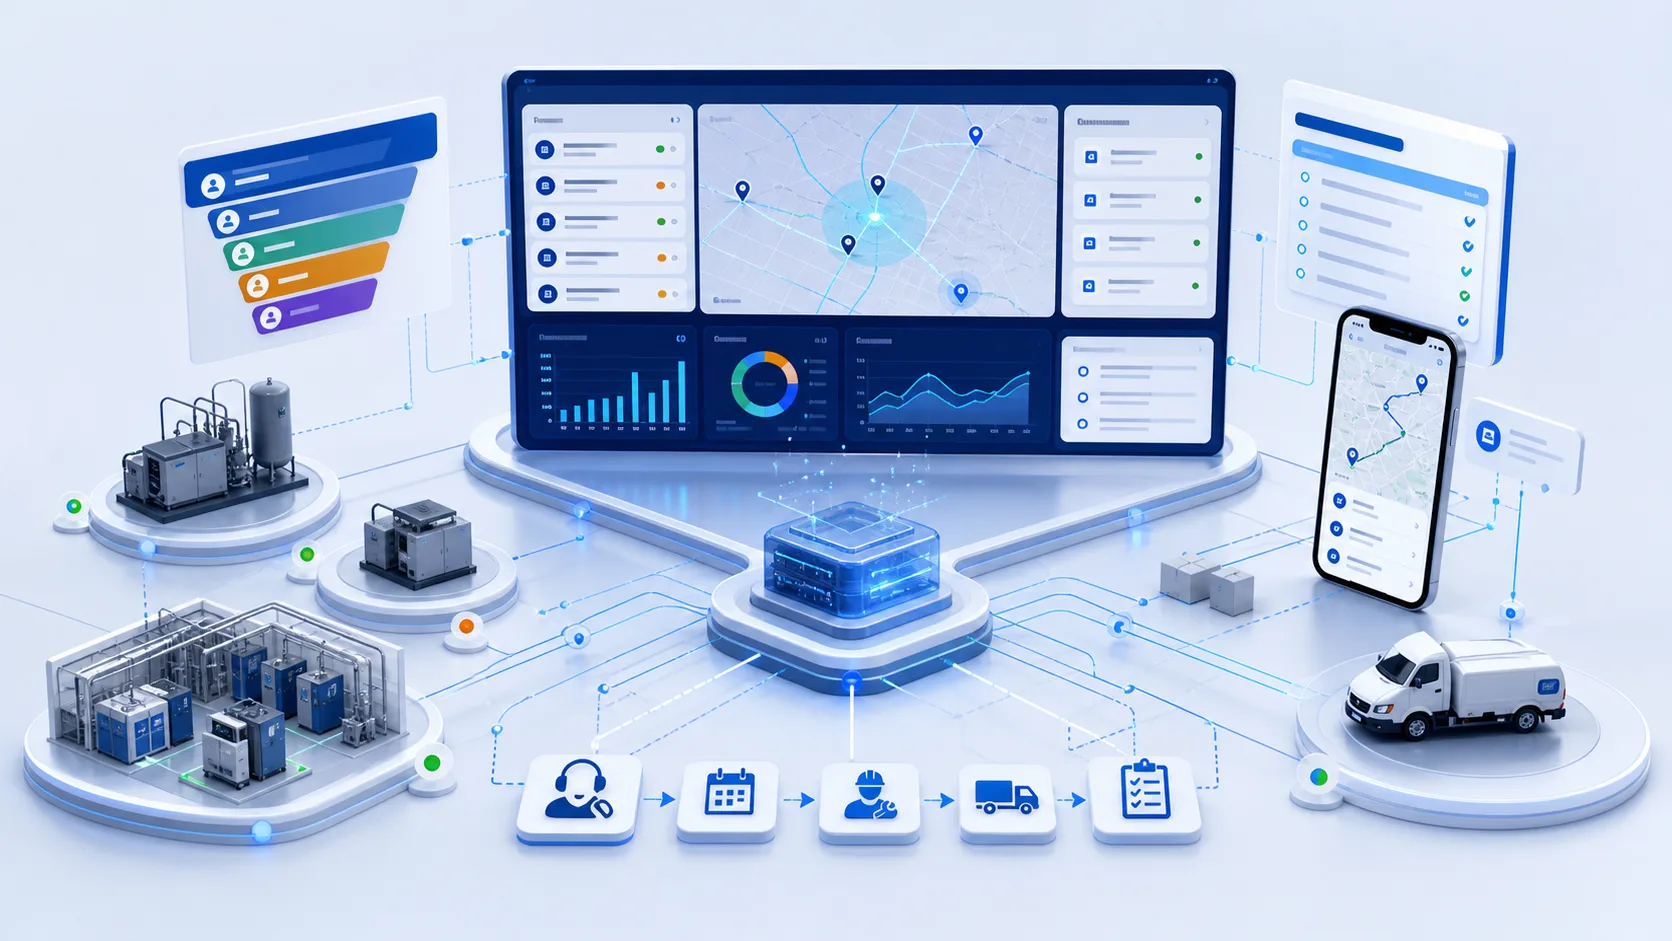
Limit violations and faults pushed via WeChat official account and other channels, with a traceable handling record.
Automatic reminders when maintenance is due; on-site staff file service requests straight to the service provider, no app download needed.
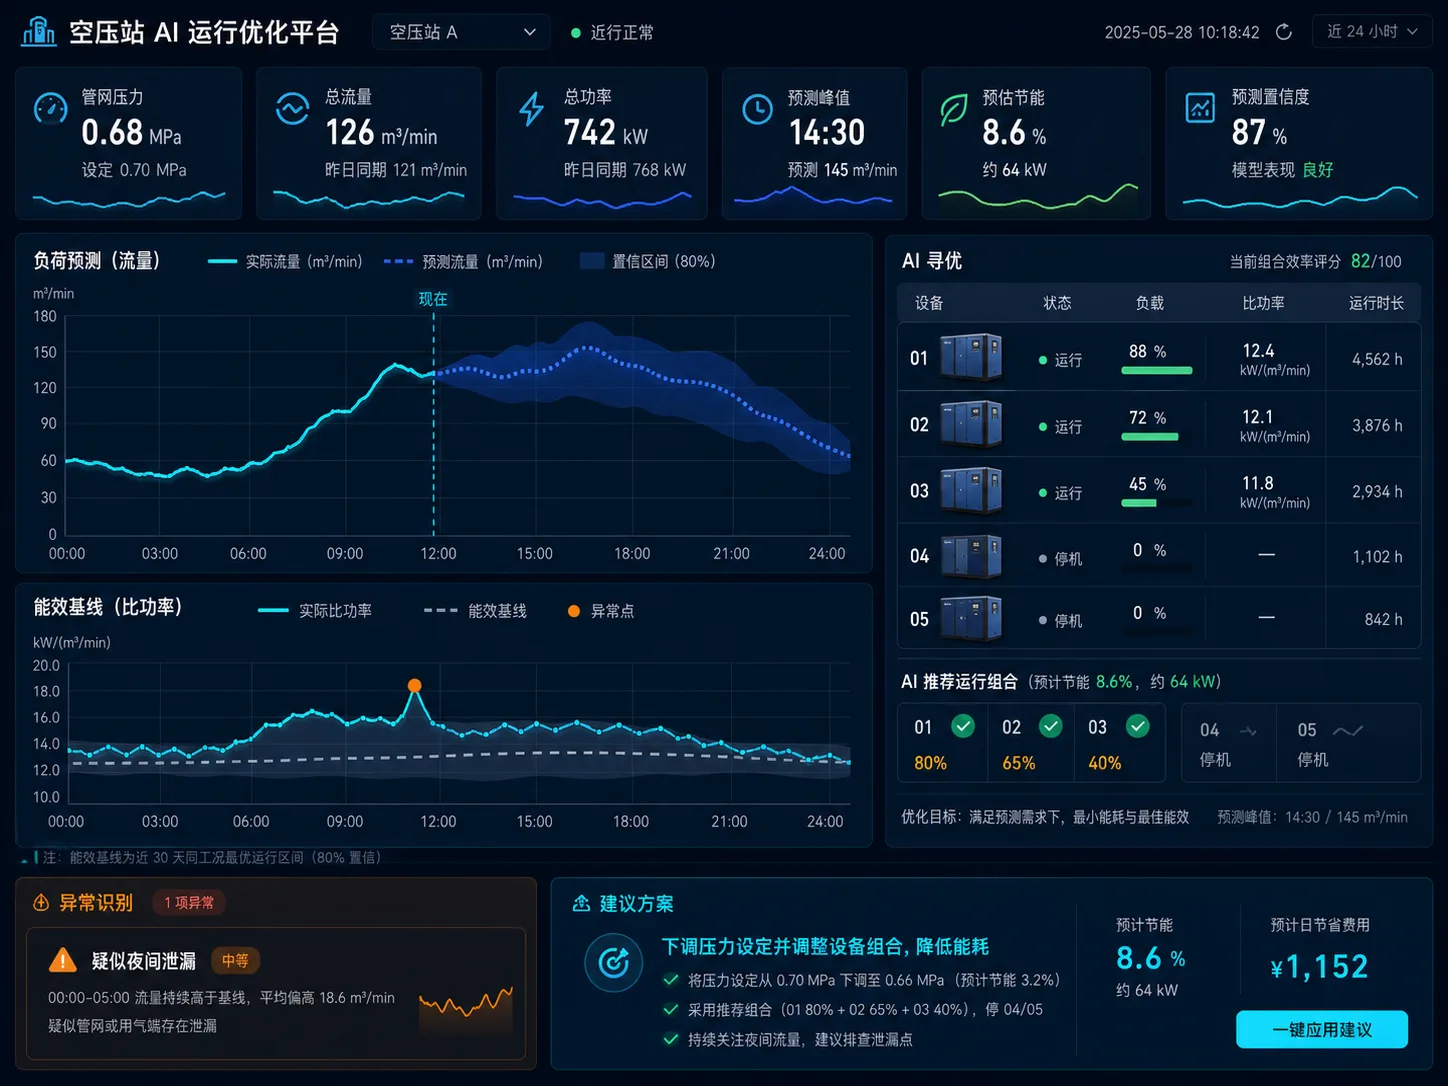
Based on load profiles and operating conditions, CompAI works out the optimal pressure setpoint, unit combination and VSD speed plan, cutting idling and unloaded running so electricity is spent on air that is actually used.

Predicts component degradation from parameter trends and running hours, replacing calendar-based servicing with condition-based servicing to cut unplanned downtime and wasted spare parts.
Cross-checks data from multiple measuring points to automatically spot abnormal operating conditions, unloaded running and pipeline leakage, dramatically shortening the time from detection to action.
Deeper AI-driven energy optimization and unattended operation are delivered by the MS master controller in the Smart Compressed Air Station solution.
Explore Smart Compressed Air Station →
Access over the Internet in a browser or WeChat mini program — zero maintenance, and the station is visible anytime, anywhere.
Standalone deployment on your intranet, integrated with your own security stack to meet data compliance and private-hosting requirements.
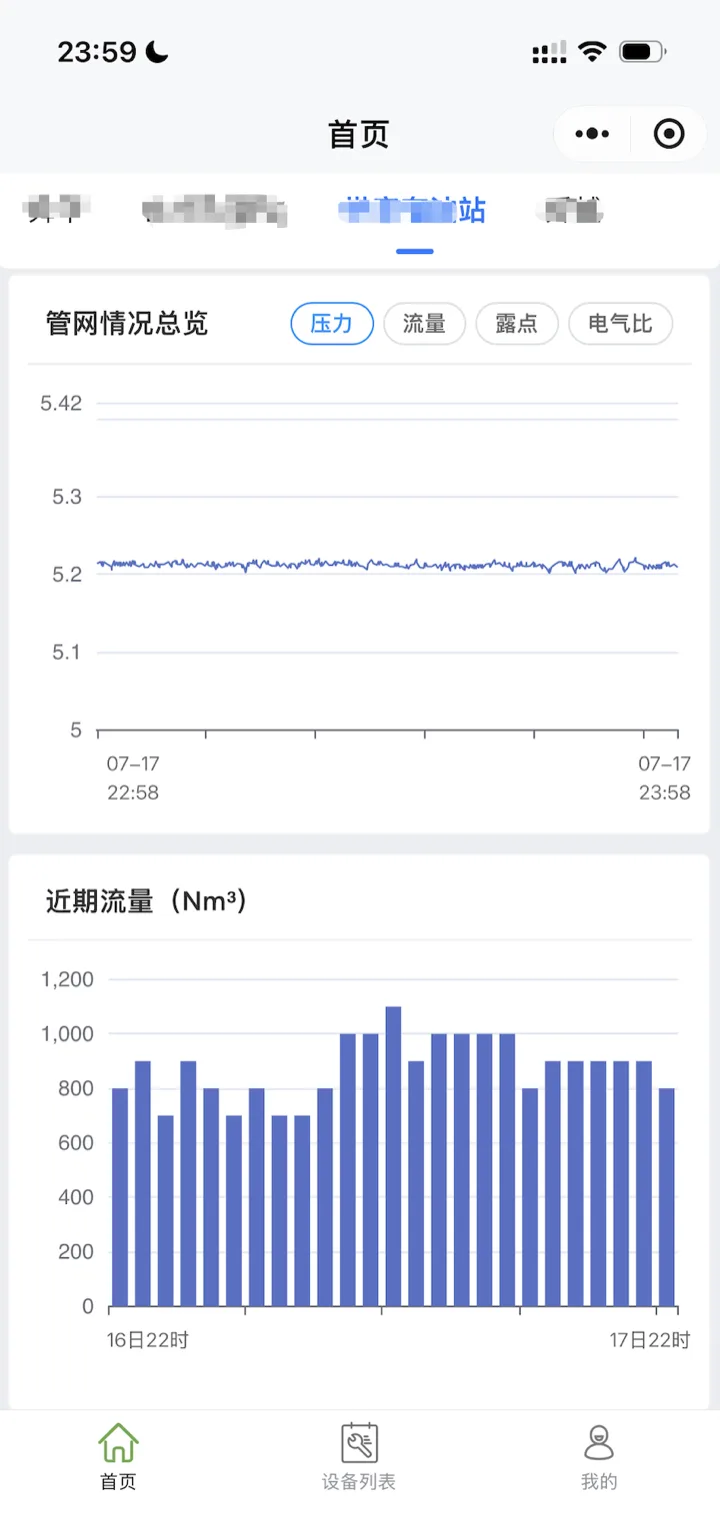
As the software view layer of a smart compressed air station, the CompView Cloud Platform takes in on-site control and acquisition data and pairs with AI analytics down the road, so operation, energy efficiency and maintenance always rest on solid data.
Trial it with your station's real data. Tell us your equipment count and site conditions, and our engineers will recommend a connection and deployment plan.